What is lychee?
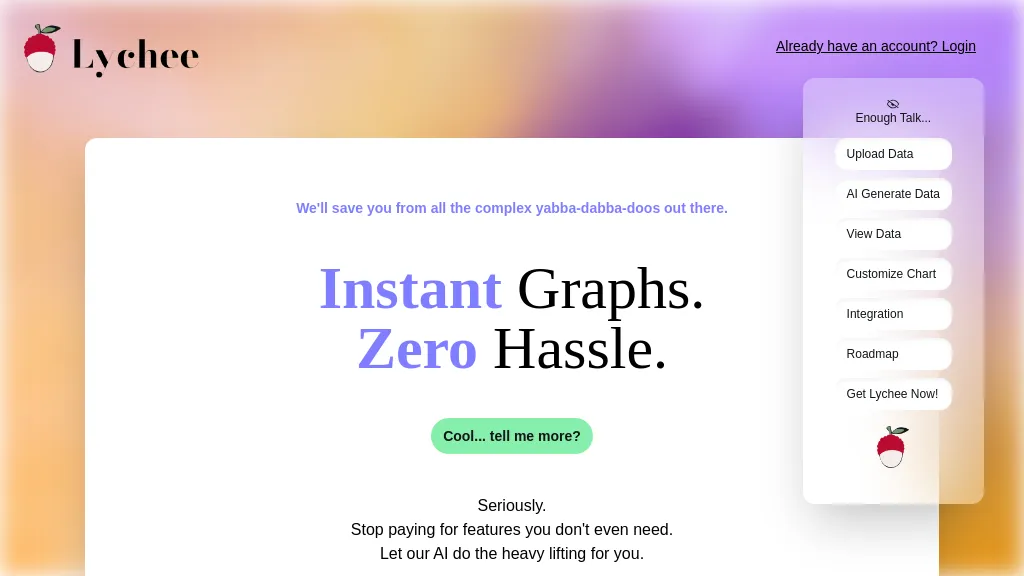
Lychee is an advanced, AI-driven data visualization platform that aims to convert raw, spreadsheet-sourced data into graphic form at record speed. Its main objective is to provide seamless ease and a user-friendly experience for nonspecialist users who need to visualize data without requiring coding skills or sophisticated features. Lychee is powered by AI technology to make the creation of graphs easy for users and eliminate technical barriers with the least amount of learning.
Key Features & Benefits of Lychee
Instant ‘Blink Of An Eye’ Data Visualization:
No delay in getting your sheets transformed into graphs within a blink of your eye.
Friendly User Platform:
No coding or complex skills are required; thus, an intuitive interface makes data graphing easy.
Cost-Effective Solution:
Invest only in what you need. Lychee’s no-nonsense approach ensures you’re not paying for superfluous features.
Variety of Chart Options:
Choose from a variety of chart options to fit your data and style.
The Excel Alternative:
Seamlessly create your dataset from scratch with no traditional spreadsheet hassles.
Among the main advantages of the service are simplicity, speed, and affordability. The competitive benefits include immediate creation of graphs, friendly interface, and great variety of chart options.
Use Cases and Applications of Lychee
Different scenarios where lychee can be applied are as follows, benefiting various industries and sectors:
-
University Projects:
Susan and other students can rapidly create comprehensive data visualizations for various assignments and research papers. -
Data Research:
Professionals can stop fiddling with overkill tools and simplify their data analysis with a tool that fits their requirement of simplicity and potency. -
Marketing Analytics:
Marketing agencies can provide instant solutions to customers with efficient conversion of data into actionable insights.
Additionally, Lychee is going to be very useful for less technical team members, allowing them to take part in projects with ease by simplifying data representation.
Using Lychee
It is very easy to use Lychee, and one doesn’t need any sort of special knowledge. Here’s how to do it in a series of steps:
- Upload your spreadsheet into the Lychee platform.
- Choose which chart you want to create.
- Label your chart with all options such as color.
- Visualize immediately the graph that you have just created.
- Export the graph, or share it as needed.
Tips and Best Practices:
Make sure to refresh your data often for correct visualizations and try experimenting with chart types to find which best represents your data.
How Lychee Works
Lychee works by integrating AI technology that automates visualizing data. Here’s a technical overview:
-
AI Algorithms:
Lychee makes use of sophisticated algorithms that parse and understand data from spreadsheets and generate graphs with accuracy and relevance. -
Data Processing:
It refers to the processing of data in real time, thus making the visual appearance instant. -
User Interface:
The user interface is friendly and hence guides even the less than average skilled users through the process.
The workflow includes upload of data, selection of options for visualization to be performed, and the graph generation, all in a couple of clicks.
Pros and Cons of Lychee
Following are a few advantages and possible disadvantages of using Lychee:
Pros
- Instant graph generation
- Friendly user interface
- Inexpensive
- Multiple chart options
- No coding required
Cons
- This may not provide for power users with more advanced features. It is designed to work essentially with spreadsheet data, and this may hamper sourcing from other forms of data.
- Ease of use and efficiency are generally cited by users in their reviews, but it lacks advanced features for some power users.
Conclusion about Lychee
In a nutshell, Lychee is one of the AI-powered data visualization software that excels in changing spreadsheets into graphs using minimal effort. Strong points: intuitively understandable interface, immediate visualization, and a moderate price. For the ones who are looking for no-headache and quick ways to visualize data, Lychee will be pretty relevant. Advanced development may evolve with advanced customization options and an ability to handle more data sources in the future.
Lychee FAQs
-
What kinds of charts are there that I can create with Lychee?
Lychee has support for up to several chart types such as bar charts, line graphs, pie charts, and so on. -
Must I know coding to operate Lychee?
No, Lychee is user-friendly, and no coding is required. -
Is there a free trial?
Lychee offers lifetime access to provide you with the best value for zero monthly fees with no free trials. -
Lychee for team projects-is this allowed?
Well, that’s basically what Lychee is for: to make data representation easier for people without a technical background.


