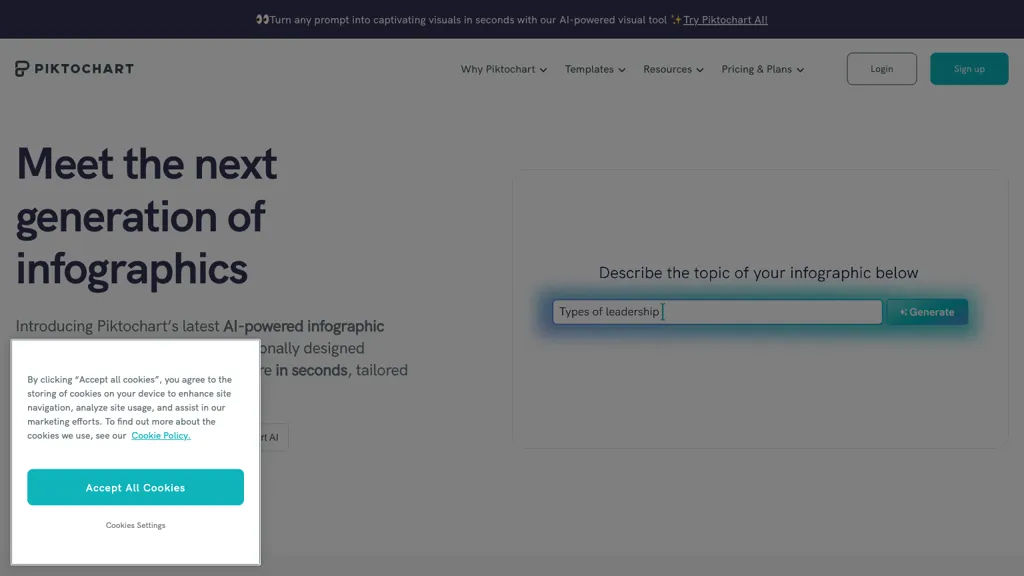
What is Piktochart?
Piktochart is an AI-pushed platform focused on helping users create engaging graphics, such as infographics, posters, banners, and much more, in just a few clicks. Its multi-application turns ideas into professionally designed visuals, letting people make really beautiful visual content without advanced graphic design skills required in the making process.
Easily create professional-quality graphics using drag-and-drop creation; Download visuals in PNG or PDF as well as export presentations to PPT for offline sharing. With this tool, you can transform complicated data into clear, eye-catching visuals: charts, graphs, and interactive maps. You can easily edit your video by having basic tools like a text overlay and subtitle editing feature, along with media optimization features.
The most important features and benefits of Piktochart are:
-
AI-Powered Design Tool:
Plugs into artificial intelligence to improve the design processes. -
Drag and Drop editor with user-friendly interface:
Helps create any visual content easily. Even users with no training in graphic design can use it seamlessly because it has a drag-and-drop editor with a user-friendly interface. -
Download in multiple formats:
Saves visuals in PNG format or PDF and exports presentations to PPT. -
Data visualization:
Uses charts, graphs, and interactive mapping to represent complex data in a layman’s form. -
Video editing function:
text overlay, subtitle, and optimize the video for social media.
With all these features, any user will be able to create an eye-catching piece of content in minutes and elevate communication to drive engagement. What stands out in Piktochart are its ease of use, AI-powered design, and data visualization.
Piktochart Applications
Piktochart is an all-purpose tool with applications in the following cases:
-
Business/Education Presentations:
Design infographics and icons that can be used to present information to an audience in a meeting, or to make a pitch. Log in and start making visually friendly posters and banners that grab attention, driving more visibility to your brand. Bring your campaigns to life with pre-built templates and customization options. -
Make Numbers Speak Visually:
Change numerical data into fabulous, fascinating visual charts, graphs, and interactive maps, which bring reports and analyses to life.
It caters to the sectors of marketing, education, business, and graphic design. The professionals it caters to are marketing and advertising professionals, graphic designers, businesspeople, teachers, and students.
How Piktochart Works
Using Piktochart is actually quite easy. Here’s how you will go about using Piktochart:
-
Sign up:
Create an account on the Piktochart website. -
Choose your template:
Take from many pre-built templates or start off with a blank. -
Customize:
Add or make changes to text, images, and charts through drag and drop. -
Export:
Save your visual in either PNG or PDF file format, or export to PPT for presentations.
Here, you will find how to use their tutorials and resources to make your Piktochart design the best using Piktochart effectively. Experimenting for the many possibilities of customization to bring out the uniqueness and graphics of your visual.
Piktochart’s AI Technology
Piktochart’s AI technology capitalizes on making design processes much easier. The program features design elements and layouts that will best fit with the content you input. All other elements can be manipulated with the drag-and-drop editor to render some clear, compelling views. Data visualization means that it will take some plain data and visualize it to be clear and easy to understand.
Generally, the process involves selecting a template, making it your own with the content, and then exporting that final product. Since Piktochart allows a number of file formats, sharing and reusing the visuals on other platforms could not be easier.
Pros and Cons of Piktochart
Some of the benefits and disadvantages of using Piktochart include:
-
Pros:
- User friendly: With a drag-and-drop editor, it is simple and available even for those who have never done any graphic design in their lives.
- AI-powered features—easily design with smart suggestions.
- Versatile export options—in multi-file formats for easy sharing and presentation.
- Rich data visualization tools, allowing users to make complex data more understandable.
-
Cons:
- Limited customization: some may feel that the rich feature available on the tool is not as rich as a feature in any professional design software program.
- Learning curve: the tool is quite user-friendly; however, it will require the new user to spend time exploring all the features and richness in-depth.
Generally, user feedback talks about the tool’s effectiveness in bringing out high-quality visuals; however, users wish for more improvements to personalization options.
FAQs About Piktochart
-
What is Piktochart?
Piktochart is an AI-driven producer of infographics, posters, banners, and other infographics. -
Who is Piktochart for?
Piktochart is perfect for marketing professionals, graphic designers, business owners, educators, and students. -
What file formats can I export visuals into?
You can export your visuals in PNG, PDF, and PPT formats. -
Does Piktochart offer a free plan?
Yes, Piktochart offers a free plan that includes basic features and limited templates. -
What are the key features of Piktochart?
Some of the main features of Piktochart include an AI-driven design tool, easy-to-use drag-and-drop editor, data visualization, and video editing.


