What is ChartGPT?
ChartGPT is an intelligent AI-powered tool that enables the generation, customization, and visualization of a wide range of chart types—from bar charts to pie charts, from radar charts to funnel charts. ChartGPT can enable innumerable varieties with different functionalities for meeting the required data visualizations. Whether it is showing the distribution of market share, the percentage of renewable energy source, or average annual rainfall across major cities of the world, ChartGPT will make sure that your data is delivered in a plain yet interactive manner.
ChartGPT Key Features & Benefits
Chart Type Creation: Supports creation of Bar Charts, Area Charts, Line Charts, Pie Charts, Scatter Charts, Radar Charts, Radial Bar Charts, Treemaps, Funnel Charts.
Chart Appearance Customization: Color modification; title and legend editing for consistency in your presentation style.
Data Visualization: Visualize data in simplified formats from complicated data.
Functional Flexibility: Handy for all kinds of Data Visualization needs arising in most spheres of life.
Benefits of ChartGPT: better clarity of data, elegance in the presentation, and rapid insights which can be drawn by presenting data. In short, this is a must-have tool for beautifying data presentation.
Applications of ChartGPT
ChartGPT is useful in many uses and domains, such as:
-
Business Presentations:
Make an insightful bar chart on market share distribution in just a few seconds. -
Stakeholder Reporting:
Visualize the renewable sources of energy in form of percentages through a pie chart so that the complex data are hereby made understandable. -
Research Analysis:
Drawing detailed radar charts comparing the average annual rainfall in major cities around the world and hence enabling fast and full analysis of data trends.
The result might be useful in industries such as business intelligence, marketing education, research, and many more. This tool will come in handy for a wide variety of professionals throughout different industries: data analysts, project managers, business intelligence professionals, marketing professionals, researchers, students, and teachers in general.
How to Use ChartGPT
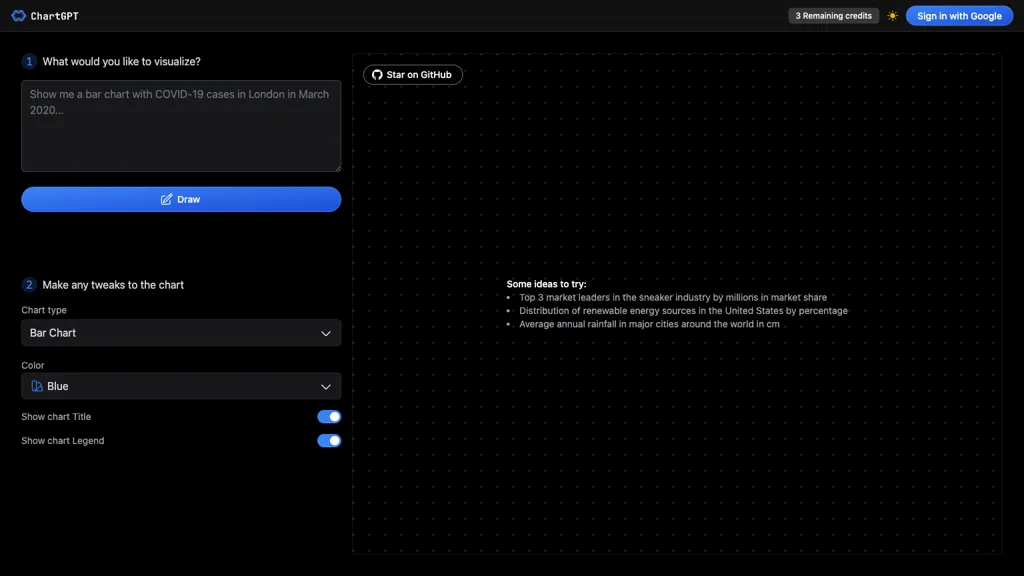
ChartGPT is straightforward to use:
-
Open Tool:
Open the browser and open ChartGPT. -
Chart Type Selection:
Choose the type of chart from the different options provided. -
Input Data:
Manually enter the data, or import directly from a file. -
Customize:
Chart colors, titles, legends, and other elements. -
Generate Chart:
Actually create your chart and see the visualization. -
Export:
Save your chart, as desired, into presentations and reports.
For it to work best, though, first clean up and structure any data going into ChartGPT. Take some time to familiarize yourself with the various chart types so that you could effectively choose the most appropriate one that best suits your needs concerning a particular view of data visualization.
How ChartGPT Works
ChartGPT visualizes data into beautiful-looking charts, all thanks to the most advanced algorithms in AI. In essence, ChartGPT interprets raw input provided to the tool through data parsing and uses visualization models to create a proper chart that represents the data. This process is smooth, from feeding the data and customizing charts to creating and exporting them.
Pros and Cons of ChartGPT
Pros:
- The interface is friendly in terms of chart creation and customization.
- Supports multiple chart types, depending on the requirement and purpose of visualization.
- Flexibility in manipulating chart elements such as colors, titles, and legends.
- It helps efficiently in communicating the involved data through visualization.
Possible Drawbacks:
- There could be a little learning for people who have not worked with data visualization tools.
- The limitation could be related to the chart type supported by the tool.
Overall, users rate ChartGPT as a powerful, useful tool in data visualization, though with minor limitations.
Conclusion on ChartGPT
In short, ChartGPT is such a great tool with which one can create and customize all types of charts, visualizing data in the most easily accessible and effective manner for its clients hailing from all walks of life. The major features, ease of use, and flexibility make it the first choice both for working professionals and students alike. Given the fact that it is always kept updated, and will be so in years to come, ChartGPT will prove valuable for data visualization needs for many future years.
ChartGPT Frequently Asked Questions
What types of charts does ChartGPT support?
You build bar charts, area graphs, line plots, pie charts, scatter charts, radar charts, radial bar charts, treemaps, and funnel charts.
Can I customize the appearance or style of the charts?
Yes, ChartGPT allows you to customize colors, titles, legends, and more chart elements according to your needs.
Is ChartGPT beginner-friendly?
Of course, ChartGPT provides a very friendly and intuitive interface for a newbie to draw up and customize charts.
Which other industries find great uses for ChartGPT?
Business intelligence, marketing, education, and research are some of the industries that find great uses for ChartGPT.
Are there limitations found in using ChartGPT?
As versatile as ChartGPT can be, it only supports types of charts that make it hard for it to be used, not to say the learning curve that new users may face.


