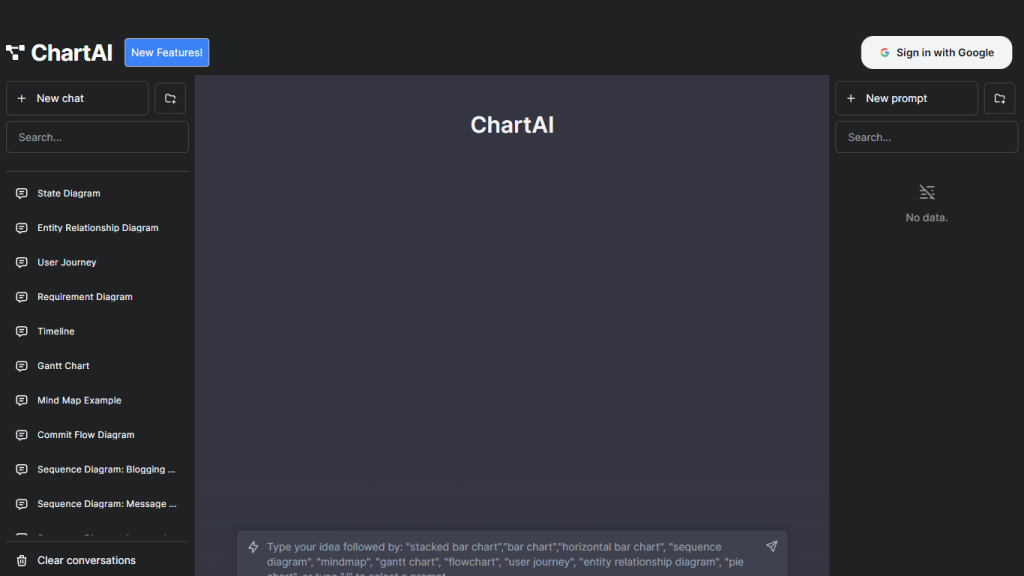
What is ChartAI?
ChartAI is the world’s very first AI-based diagram and charting application to digitize the diagram and chart-making process with total ease. Feed your data and diagram requirement, and in minutes, its Artificial Intelligence engine shall generate diagrams of professional quality. Perfect tool for professionals looking to visualize data with speed and impact.
ChartAI: Key Features & Benefits
Diagramming: No hassle in creating different types of diagrams.
Data Input: Input data from different data sources with ease.
AI Engine: Deploys advanced AI to automate diagram creation.
Professional Looking Diagrams: Create polished, presentation-ready diagrams.
Quick Build: Speed up your diagramming process significantly.
It has numerous features, hence giving it versatility to be used by different professionals. It has line charts, bar charts, pie charts, scatter plots, amongst others. One has the freedom to change visual attributes like color, labels, and fonts according to one’s liking. Therefore, it is flexible and a potent tool in data visualization.
Use Cases and Applications of ChartAI
ChartAI is an all-purpose tool applicable to many industries and sectors. These include flowcharts for project management, which are beneficial in smoothing the workflow of projects and process visualization, and charts for data visualization during presentations, making your presentations impressive. This is also useful in organizational charts, important in creating detailed and clear organizational structures. From business professionals and data analysts to educators, ChartAI helps users communicate complex information clearly and with impressive visual aids.
How to Use ChartAI
Using ChartAI is quite easy. Here is a step-by-step guide to using it:
- Input your Data: Import data from CSV, Excel, or Google Sheets.
- Chart Type Selection: Choose Among various chart types and styles.
- Customize: Color, label, font, interactivity with tooltips, and animation.
- Generate: Finally, let ChartAI analyze your data and generate the final chart or diagram.
To get the best result, follow these tips and best practices:
- Make sure your data is clean and well-organized before you import.
- Customize to your branding. Make use of interactive features to build more engaging visualizations.
How ChartAI Works
It masters sophisticated AI algorithms that execute the analysis of the inputted data and further automate diagram creation. The real-time calculations, coupled with dealing with huge data sets, underpin the technology to become a powerful tool in creating meaningful insights. From importing the data to selecting the chart types and customizing visual elements, everything is part of the workflow before finally creating it.
Pros and Cons of ChartAI
This tool, though having its pros like any other tool also has some cons which include:
Pros
- This automates diagram creation and hence is time and effort-efficient.
- This huge array of chart types comes with a full range of options to customize the charts.
- It features a user-friendly interface that makes it easy for all users regardless of their technical level.
- Some of the pros include advanced data analysis.
Cons
- For those using AI less frequently, it might give a learning curve.
- The freemium model might be limiting up-front access to advanced features.
On the other hand, reviews by users have been overwhelmingly positive, many of whom praised its efficiency and simplicity.
Conclusion about ChartAI
Well, to generalize, ChartAI is a critically acclaimed, very intuitive AI-driven instrument for the creation of professional diagrams and charts. Among the key features, along with usability and flexibility, are what make it extremely professional and useful for many professionals representing a variety of fields of activity. With its constant development and updating, ChartAI is sure to remain at the top in this niche.
ChartAI FAQs
What types of graphs can I create with ChartAI?
It will also include—line charts, bar charts, pie charts, scatter plots, and many more.
Can I customize how my charts look?
ChartAI will have a comprehensive set of options to change colors, label fonts, and other display options.
Is ChartAI easy to use for beginners?
Yes, definitely. The intuitive interface and different levels of skill will let any user feel comfortable working with our tool.
What data formats does ChartAI Support?
Yes, ChartAI does support importing data from some popular file formats like CSV, Excel, and Google Sheets.
Does ChartAI support interactivity in charts?
Yes, interactivities in charts would mean things such as tool-tips, zooming, panning, and animations.


