What is VizGPT?
Very soon, VizGPT will change the face of data visualization with its intuitive and natural user-friendly interface in the form of chat. This ingenious platform allows users to transform complex data into meaningful visuals with much ease. By conversing with the chatbot, one is able to create charts and graphics that will produce results that are accurate, hence changing how data-driven decisions are made.
VizGPT was developed for the very purpose of making this process more efficient. Leveraging advanced algorithms, it interprets textual descriptions to create meaningful forms of graphics. For a data scientist or business analyst, or any other user working frequently with data, VizGPT automates the process of visualization by turning any textual description of data into an interaction-ful chart in no time.
VizGPT: Key Features & Benefits
-
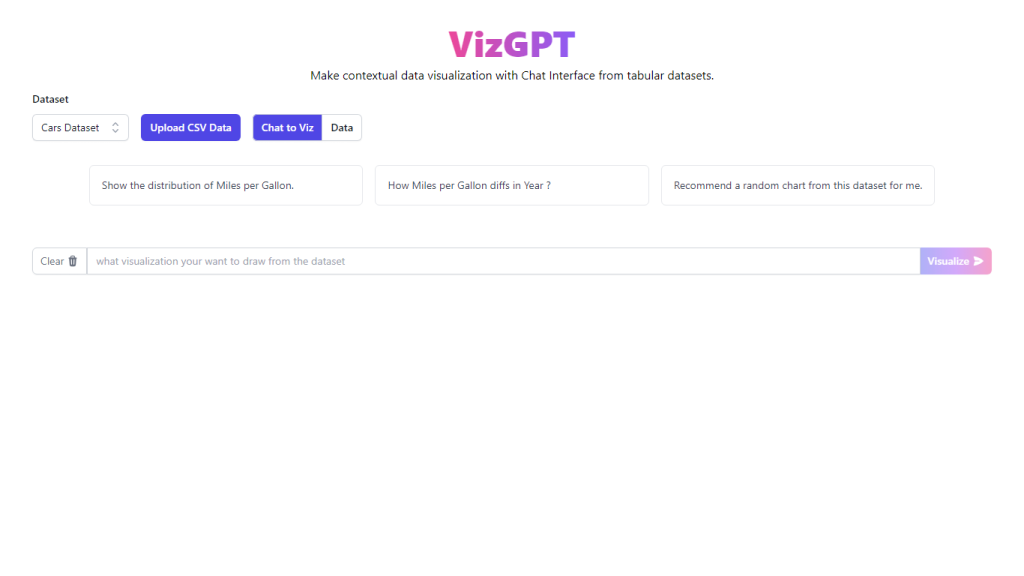
Intuitive Chat Interface:
Simplify creating data visualizations through natural conversation. -
Contextual Data Visualization:
It creates relevant charts and graphics from data provided with a context. -
“Text2Viz” Capability:
Descriptions of data in text are directly turned into visual charts with this system. -
“Text2Chart” Function:
It facilitates the creation of a chart from descriptive text with much ease by the user. -
Efficient Data Interpretation:
Advanced algorithms are used for quick and reliable visualization output.
By doing so, VizGPT will help users in making better data-driven decisions, save hours of work connected with tasks related to data visualization, and provide an intuitive and efficient way for interpreting complex data.
VizGPT Use Cases and Applications
VizGPT can be applied to a wide array of use cases and industries, delivering extensive value to professionals and organizations. A few examples include:
-
Data Science:
VizGPT enables data scientists to quickly render a view of complex data sets and uncover trends and patterns. -
Business Analysis:
Business analysts are better placed in creating visual reports back from textual data, thus enhancing their presentation techniques and decision-making processes. -
Market Research:
Researchers are in a position to transform results from surveys and market data into easy analysis and reporting in graphical charts and presentations. -
Education:
The educators can use VizGPT to generate visual aids based on textual information and make the lessons more interactive, lucid, and clear to understand.
These use cases epitomize the versatility that VizGPT holds and can bring value across different sectors.
How to Use VizGPT
Using VizGTP is quite easy, especially due to the presence of the chat interface. Here are the steps for using this great tool:
-
Sign up:
Open an account on the VizGPT platform. -
Input data:
Provide your textual data description in the chat interface. -
Generate Visualization:
The chatbot interprets your input and generates the corresponding visual chart or graphic. -
Review and Edit:
Review the generated visualization and edit if necessary to ensure that it meets all your requirements.
Tips and Best Practices:
- Be specific and clear in your textual descriptions for accurate visualizations.
- Make good use of the platform’s contextual understanding with relevant data and context.
- Play around with different data sets to understand the ability of VizGPT.
How VizGPT Works
VizGPT uses advanced algorithms to read and express a description of data in words into images. Here is what happens at the back end:
-
Text Analysis:
The text that is input is read and understood in context for the data. -
Algorithmic Interpretation:
Advanced algorithms are run on this text to identify what kind of visualization would be appropriate. -
Chart Generation:
It generates the chart or graphic corresponding to the interpreted data.
VizGPT, hence, becomes a very robust tool in visualization for output that is fast and reliable for both data analysis and its presentation.
Pros and Cons: VizGPT
The pros of the application of VizGPT are as follows:
- The chat interface is user-friendly for visualizing the data.
- Complex algorithms guarantee correct and relevant visual output.
- There are many use cases across different industries.
The cons or the limitations could be that it might require text-based explicit descriptions to return the best results. It would have lesser customization compared to traditional tools of data visualization.
Feedback and reviews from users show the high efficiency and user-friendly interface of VizGPT. Yet, there are some users who have recommended more advanced features in customization.
Conclusion on VizGPT
VizGPT is the latest tool in data visualization, which combines intuitive chat interface with complex algorithms to come up with appropriate visual results. Its flexibility and simplicity make it an instrument of high value to professionals in various walks of business.
The toolkit’s potential as a very powerful tool in data-driven decision-making will most probably further increase with future development and enhancements. Whether you’re an experienced professional dealing with data or a young lad just starting to look into data analysis, VizGPT provides an easy and shortcuts-rich path toward the visualization of complex data sets.
VizGPT FAQs
-
What is VizGPT?
VizGPT is a high-end tool for data visualization featuring a chat interface for text-based data descriptions that translates them into visual charts and graphs. -
How does VizGPT work?
VizGPT makes use of complex algorithms in the interpretation of textual data descriptions and creating relevant visualizations accordingly. -
Is there a free version of VizGPT?
Yes, there is. VizGPT offers a freemium model with a basic free version and premium plans for additional features. -
What industries can benefit from VizGPT?
VizGPT is versatile and can be used in data science, business analysis, market research, education, and many other fields.


