What is PlotGPT?
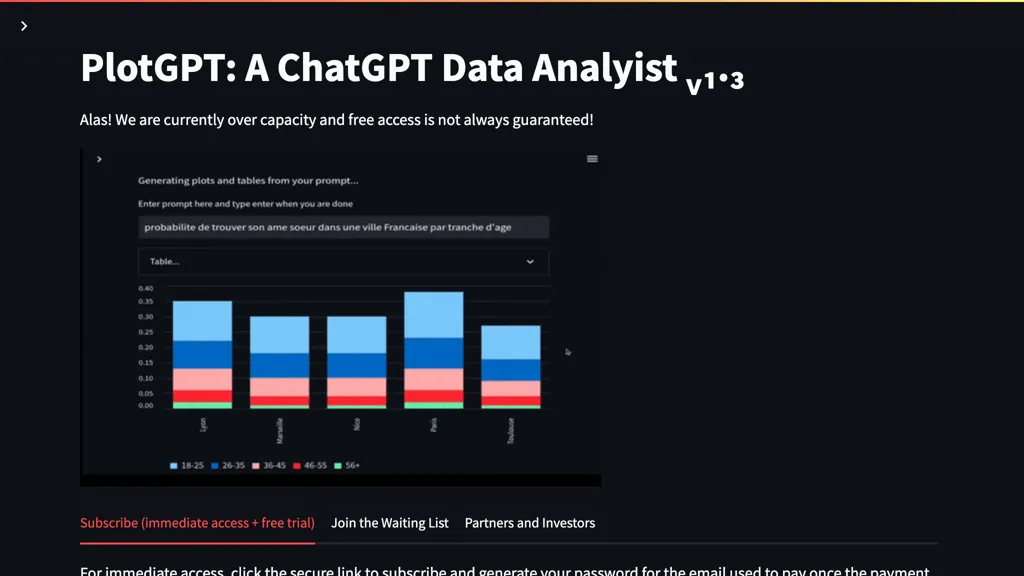
PlotGPT is an AI-based proactive data analyst turning user prompts into elaborate infographics, charts, tables, and plots. Be it investment ideas, location analysis, or personal statistics, PlotGPT has easy and simple data visualization to back up your decision-making process. This AI tool is great for improving productivity, making the right investment decisions, traveling, and even in some of your personal life decisions.
Key Features & Benefits of PlotGPT
There are strongly vested features in PlotGPT for use cases by its diverse users. Following are some of its major features and associated benefits:
-
Generate Infographics:
Turn plain text into very engaging and informative infographics. -
Provide investment ideas:
Get astute investment ideas from data analysis. -
Provide locations and travel choices:
Understand location details to make traveling decisions. -
Life Decisions:
Get data-driven insights to make better life decisions, be it career moves or personal relationships.
These features enable the end-users to significantly enhance their productivity, drive better investment decisions, and optimize day-to-day decision-making.
Use Cases and Applications for PlotGPT
PlotGPT is a versatile tool that finds its place in many scenarios. Let’s consider some more specific examples of its use cases:
-
Data Analysts:
Raw data is converted into a digestible form, with visualization to better understand and report on the data. -
Investors:
Extensive charts and tables assessing market trends and investment opportunities are created. -
Real Estate Professionals:
Property values and market conditions are estimated according to elaborate infographics and plots. -
Relationship Seekers:
Identify relationship patterns and probabilities from the given statistical data. -
Statisticians:
Generate proper and insightful statistical visualization that will be helpful for research and analysis purposes.
How to Use PlotGPT
Getting started with PlotGPT is quite easy. Here is a step-by-step approach:
- Sign up for a free account on the PlotGPT platform.
- Input your data or ask questions in simple text.
- Choose the kind of visualization you want, such as infographic, chart, table, plot.
- Let PlotGPT process the data to generate the visualizations.
- Analyze the results and come up with meaningful decisions.
Notice that the better results are obtained by detailed and specific data inputs. It is easy to navigate through the user-friendly interface to get the best out of this tool.
How PlotGPT Works
PlotGPT applies advanced machine learning algorithms and natural language processing to analyze data and generate visualizations. Technically, here is how it works:
-
Data Input:
Users provide data through text prompts. -
Data Processing:
Complex algorithms are used to process input data. -
Visualization Generation:
PlotGPT will generate proper visualization based on the purpose of the query, such as charts, tables, and infographics. -
Output Delivery:
The generated visualization is then presented before the user in forms that are easy to comprehend.
This, therefore, gives a seamless experience to the user to obtain clear and actionable insights from their data.
Pros and Cons of PlotGPT
As with any tool, PlotGPT has its pros and cons. Here is a balanced view of both:
Advantages:
- Easy to use with a user-friendly interface for people having different technical backgrounds.
- Rich Visualizations: The ability to create a wide range of visual data representations.
- Saves Time: Fast and converts each complex view into an easily understandable format.
- Cross-industry Applications: Can be used within a wide array of industries and use cases.
Possible Drawbacks:
- Dependence on Data Quality: The accuracy and specificity of the input data determines whether the visualizations would be accurate or not.
- Long Learning Curve: Some users may need time before they can actually use all features.
Users generally report good feedback; many of them appreciate how it can make complex data analysis tasks easy.
Conclusion about PlotGPT
In a nutshell, PlotGPT is an AI data analyst that puts data into meaningful visualizations, hence improving decision-making processes for fields of all nature. The user-friendliness, comprehensiveness, and versatility set it to be a viable partner for enhancing any type of data analysis capability. Of course, it does not come without flaws, but the pros weigh heavier than the cons, so truly worth the investment a person or any professional would make. More functional and more user-friendly is where future updates and developments are likely to take this tool.
PlotGPT FAQs
Frequently Asked Questions
Q: What kinds of data can I feed into PlotGPT?
A: Most of the data fed includes text-based prompts regarding investing, travel, personal statistics, etc.
Q: Can PlotGPT be easily used by non-technical users?
A: Yes, PlotGPT has a user-friendly interface that makes it usable by people having any level of technical background.
Q: How accurate are visualizations developed by PlotGPT?
A: The accuracy of visualizations depends on the quality and details available in the input dataset. The more detailed and accurate the data, the better the results.
Q: In what industries will PlotGPT be beneficial?
A: PlotGPT will be quite helpful in industries related to finance, real estate, research, and personal development for data analysis and visualization.


