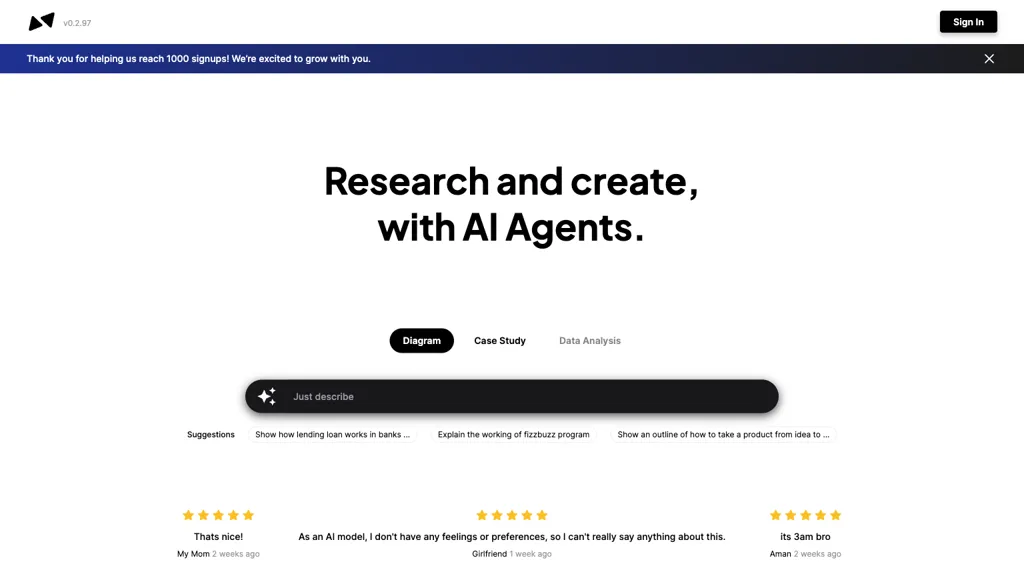
What is Diagram.chat?
Diagram.chat is a state-of-the-art AI-driven data analysis and visualization tool in case studies. With its new version, 0.2.97, users can quickly make sense of complex information through AI-generated diagrams and charts. The interface is user-friendly, with an intuitive dashboard that is well navigated and merges the effective use of insights derived from AI.
Key Features & Benefits of Diagram.chat
Diagram.chat has much more to its credit in terms of features and benefits, making it an all-time favorite across different categories of users. A few of the major features include the following:
- Data Analysis: It allows for detailed examination and interpretation of datasets.
- Case Study Visualization: Such diagrams will let users create a visual depiction for their case studies.
- Generation of Diagrams and Charts: This happens in very appealing visuals and is completely automatic.
- AI-generated Insights: These are actionable insights derived from AI algorithms.
- User-friendly interface: Easy to use, smooth navigation.
The advantages of using Diagram.chat lie in the fact that it helps to better understand your data, smoothen workflow efficiency, and communicate complex information more easily. It has two major USPs: AI-driven insights and the simplicity of its user interface.
Diagram.chat Use Cases and Applications
Diagram.chat finds applications across various use cases:
- Build interactive data visualization dashboards that automatically create dashboards for complex datasets in a way so that key insights of the data-set can be derived at a glance rather than putting so much manual effort into it.
- Real-time Collaboration: Collaborate with fellow team members in case study analysis and visualization for maximizing the efficiency of workflow while enhancing understanding of data presented.
- Attractive Slides: Slides that turn bloated research into easy-to-understand diagrams and charts, ready for use in an academic or business setting.
It caters to industries and sectors, including—but not limited to—data analysis, business intelligence, academic research, and project management.
How to Use Diagram.chat
Using Diagram.chat is pretty straightforward:
- Sign up: Head over to the Diagram.chat website and sign up.
- Upload data: Upload the dataset to the platform.
- Visualize: Create diagrams and charts on the go.
- Collaborate: Share your visuals so that the members can work on it simultaneously.
- Present: Present with impact, backed by visualizations automatically generated for your results.
For best practice, before its upload, clean and organize your data. Make sure to familiarize yourself with the interface for maximum efficiency, and leverage its collaboration features to drive greater productivity within teams.
How Diagram.chat Works
Diagram.chat is powered by state-of-the-art AI algorithms whereby raw data creates meaningfulness in its visual representation. This ingests input data and applies machine learning models to generate insights. Fundamentally, this means that the workflow contains importing data, analysis by AI, generation of visuals, and lastly the presentation of output. This underlying technology will ensure full-of-insight visualizations, accurate to help a great deal in understanding data and decision making.
Diagram.chat Pros and Cons
Diagram.chat has various pros associated. They are as follows:
Pros
- AI-driven insight improves data analysis accuracy.
- Easy to use and user-friendly UI for each level of expert system.
- Real-time collaboration for enhanced efficiency in the working of the team.
- Versatile applications across multiple industries.
Possible Cons
- For people who are not that familiar with AI-based tools, it might be a little steeper on their part.
- While it is very effective for data visualization and with respect to user-friendliness, most of the reviews about this tool mention that subscription costs could be high for some users.
- Some of these reviews mention the need for better user onboarding and flexibility with respect to pricing.
Conclusion on Diagram.chat
Well, diagram.chat in general is a very powerful AI tool with regard to data analysis and visualization. It all goes from user-friendly interfaces to AI-powered insights: everything to understand complex data sets. There could be some learning curves involved in the beginning along with considerations of pricing, but on the whole, it would compensate for the benefits and efficiency gains. This no doubt shall still be improved with successive updates.
Diagram.chat FAQs
Q: Diagram.chat is beginner-friendly?
A: Diagram.chat has a user-friendly interface which can, therefore, be used by any person irrespective of their level of skill.
Q: Can I invite others to work on Diagram.chat with me?
A: Yes. Diagram.chat supports real-time collaboration in that it allows team members to work on the platform simultaneously.
Q: What type of data can I upload on Diagram.chat?
A: One can upload several types of datasets, including CSV, Excel, and other common data formats.
Q: Any limits in the free plan?
A: Free Plan will give only basic features with limited capabilities, good enough for personal usage or initial trials.
Q: How often are updates released?
A: Diagram.chat is very frequent about updating its functionality. Just keep checking their website for the latest version.
For troubleshooting of even more specific issues, refer to the official Diagram.chat support documentation or contact their customer support.


